Math Vocabulary becomes Art: Playing with Wordle
So, I’m sitting in the conference room with two fellow instructional coaches, and I just showed them Wordle. And all three of us are intrigued with how we can use this Internet based classroom tool.
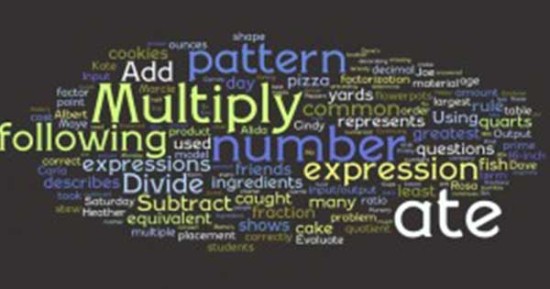
Wordle is a tool for displaying words as a graphic image. The size of the words is a relative indicator of their frequency of use.
In Wordle: Seeing Science Images as Art, Dr. Rillero, I was immediately intrigued by what Wordle creates with text.
So, why would a classroom teacher want to spend time on Wordle?
The word analysis and count feature gives teachers important information as to how often academic content vocabulary terms are used in a text. In regards to assessments, knowing how many times content vocabulary is used can help the teacher make sure he/she is using the same terminology in their instructional delivery.
This week is benchmark assessment week in the Avondale School District. So, I immediately thought of the math assessments hundreds of students will be taking on Monday.
I thought it would be interesting to “see” what words were most often used in the 6th grade assessment. Knowing that this quarter’s focus was on fractions, I was expecting to see words related to fractions as the largest ones in the art creation.
I should note that I included only the text for the questions stems, not the answers. This is what I got:
I was really surprised that “ate” was one of the largest words. Using the word count feature, I found out it was used 13 times.
“Multiply” was used 10. This tells me that many of the fraction problems are given in the context of eating some type of food! Maybe a redesign of some of these problems is necessary. Fractions can be used in many other contexts! I wonder what kind of Wordle art the AIMS (Arizona Instrument to Measure Standards) practice tests would create?
In the Math Classroom
I can easily see a math teacher using the information provided by Wordle in a data analysis unit. The word count provided with each Wordle art is a good source of data to be graphed and analyzed. Students can use current event articles posted online from sources such as CNN, FOXNews, or BearEssential News as the text, and do an analysis of the word usage. The data can be interpreted (and displayed) in many different ways: content vs. everyday language, frequency of word usage, or even determining the frequency of how many words with 3, 4, or 5 letters.
The possibilities are vast with Wordle.


